Introducing “Late-Tie Leakage”
Or; a statistical analysis on shitting the bed before overtime
Welcome back to The Loser Point blog, where we bring a Dom Luszczyszyn-like energy to the parts of hockey that nobody likes!
Hopefully you’re excited about the start of a new NHL season. Clean ice, fresh hope, and a brand new chance to totally underachieve on everyone’s expectations.
When the Rangers opened their season in Boston on Tuesday night, I was awash with said hope. Bright-eyed and bushy-tailed, I donned my away-white and popped on a centennial hat, eager for a hot start to the new year.
Don’t get me wrong, I’m not delusional. I know these Rangers are like the Park Avenue equivalent of an aging rich hag with too much plastic surgery. I totally get how “not good” this team is expected to be. But that won’t stop me from lining up for game one with a rose-colored visor improperly pushed up my helmet.
They say hope springs eternal, but the people who said that never watched their favorite hockey team get shut out across two consecutive season openers. Last year’s squad signaled their incredible knack for not scoring by also throwing up a goose-egg on night one, making Arthur Silovs look like prime Patrick Roy.
This year’s season opener was even more frustrating to watch, especially for The Loser Point. Not only did they fail to make Boston fans defensively nervous at any point, they literally tossed away a hypothetical point (or two) by giving up the tie-breaking goal with less than four minutes to play in the third.
Clench those cheeks just a bit harder, boys, and we’d have woken up on Wednesday with at least something in the bank.
Imagine my face when Fraser freakin’ Minten broke the tie mere seconds after I had tweeted out something to the effect of - “This EXACT scenario is what inspired the site!”

Oh, the irony! First game of the season and, not only could this team not put the puck in the net — again — but they failed to drag a loser point from a predominantly tight hockey game. Comme c'est tragique!
It’s bad clock management, simple as that. If this was the NFL, we’d be ripping the Rangers coaching staff for not knowing how to run a two-minute-drill.
Now I want to pause right here and reveal that I started to write this blog post while my blueshirts are beating the absolute pants off Tampa Bay in our home opener. It’s 5-1 as the game winds down, and I just watched Igor Shesterkin score the first goalie goal in New York Rangers history. We apparently can put the puck in the net. Leaning into a “hopeless hockey fan” narrative at this exact second seems pretty disingenuous, so we’ll take our hand off the big red TANK button and let the season breathe a bit.
Nevertheless, a statistical question exists within that first game loss to the Bruins that we here at The Loser Point are ripe to answer. For a site that focuses on how consolation points affect playoff brackets, it only makes sense that we’d study the absence of them as well. But how do we do that exactly…?

Well that Rangers-Bruins game provides a perfect example from which to work. From a fan’s perspective, one team was less than five minutes away from starting their season with at least a point. Then they shat the proverbial bed. A lost loser point opportunity if ever there was one.
Once the first goal went in, the Rangers demonstrated a common occurrence of many late-close-games in that their opponent was able to score even more goals before the final buzzer. Usually it’s because the losing team has pulled their goalie, but in this instance Braden Schneider also felt like contributing to the “why” behind Boston’s two insurance goals.
Braden Schneider, please go sit down.
— Snark Messier (@SnarkMessier) September 30, 2026
So we can’t just look at the game’s final score to determine whether or not it was close. A 3-0 game on paper was 0-0 with less than five minutes to go. Similarly, a 3-0 game may have had its tie broken early in the first. One of those games had fans expecting a point up until the final moments. The other had fans wondering why the hell they even bother for a full two periods. We need a solid, time-based scenario foundation from which to build…
Introducing Late-Tie Metrics: LPL & LTC%
So the first step is establishing the common conditions in which we can start to quantify “loser point leaks”. For example, it makes sense that the two teams would have to be tied at some time during the third period for either of them to have a real expectation of points. Even if the trailing team is absolutely buzzing around the ice, hitting posts and getting totally goalie’d, their argument for “almost” would be a bit too revisionist. And a lot less measurable.
So we start there - the two teams have to be tied at some point in the third for the lost loser point to really factor in. But “when” they’re tied in the third should probably matter too, right? Surely a tied game with fourteen minutes to go feels different than one with four minutes remaining. But where do we draw the line?
I initially ran a historical analysis across last year’s games to understand how many “Loser Point Leaks” occurred for each team using a 10-minutes-to-go threshold, as well as 5-minute and 3-minute windows. It was a little bit of a Goldilocks situation, with the 10-minute view feeling a bit too big while 3-minutes felt entirely too small.
But the 5-minute band also didn’t sit well with me. The most obvious reason for wanting to expand it a bit more was simply to get more qualifying games in the mix and grow our sample size. Outside of the statistical significance, I also wanted to maximize the cultural weight of this all-important number and ensure that whatever time slot we settled on would appease the universal gods of math and hockey. So we went with seven…
OK - so we’ve established that the two teams need to be tied at some point with seven or less to go in the third period. Even if a team is down by a goal or two and somehow manages to tie it up with less than seven minutes on the clock, that scenario still registers as a “Late-Tie” situation where a hypothetical loser point could still be in the cards. Should either team concede a goal during that “late-tie” period and blow their chance of at least taking a point, we can comfortably label that as a missed opportunity.

We needed to settle on some parameters in order to consistently quantify and contextualize this careless behavior across the course of a season. And it feels like we’ve got as good a logic as we could while arbitrarily picking a window of time in the third period to use. So in lieu of calling it “Beds Shit Per Season”, we’ve labeled them “Loser Point Leaks”...
While you might say the team who blew their late-game-tie, in some alternate universe where they didn’t ultimately lose in regulation, may have wound up winning that imaginary OT or hypothetical shootout — fact is that, as far as we can reasonably measure, they only threw away one guaranteed point. There are too many ifs and buts beyond the buzzer to count this as anything more than one lost point.
But what do we do when no one shits the bed? Surely there’s analytical value in understanding exactly how often teams don’t blow their shot at a consolation point, at least in relation to the rest of the league’s ability. So we calculated “Late-Tie Conversions” across each team to establish their ability to properly clench collective butt.
So now, not only do we have a shiny-new framework for contextualizing team results when a game requires more than 60 minutes, we can also measure the standings-point impact of NOT being able to drag close games into extra time.
- Loser Point Leak: a “late-tie” qualifying game ends in a regulation loss.
- Late-Tie Conversion: a “late-tie” qualifying game that ends with at least one point — either through regulation win, OT/SO win, or OT/SO loss.
- Important to note: a “Late-Tie Conversion” does not require reaching overtime. Scoring the winner in regulation is a perfectly respectable way to avoid leaking points.
- LTC%: percentage figure representing total conversions divided by total “late-tie” qualifying opportunities.

Surely this data will validate all my feelings, right?
As I’ve stated before in blog posts past, the main fan frustration behind making this site was exactly these late-tie scenarios. According to my very-trustworthy-these-days memory, the Rangers lost approximately 68 games last year while being tied late in the third. They’d obviously be top of the Loser Point Leak leaders for 2025-2026, right?
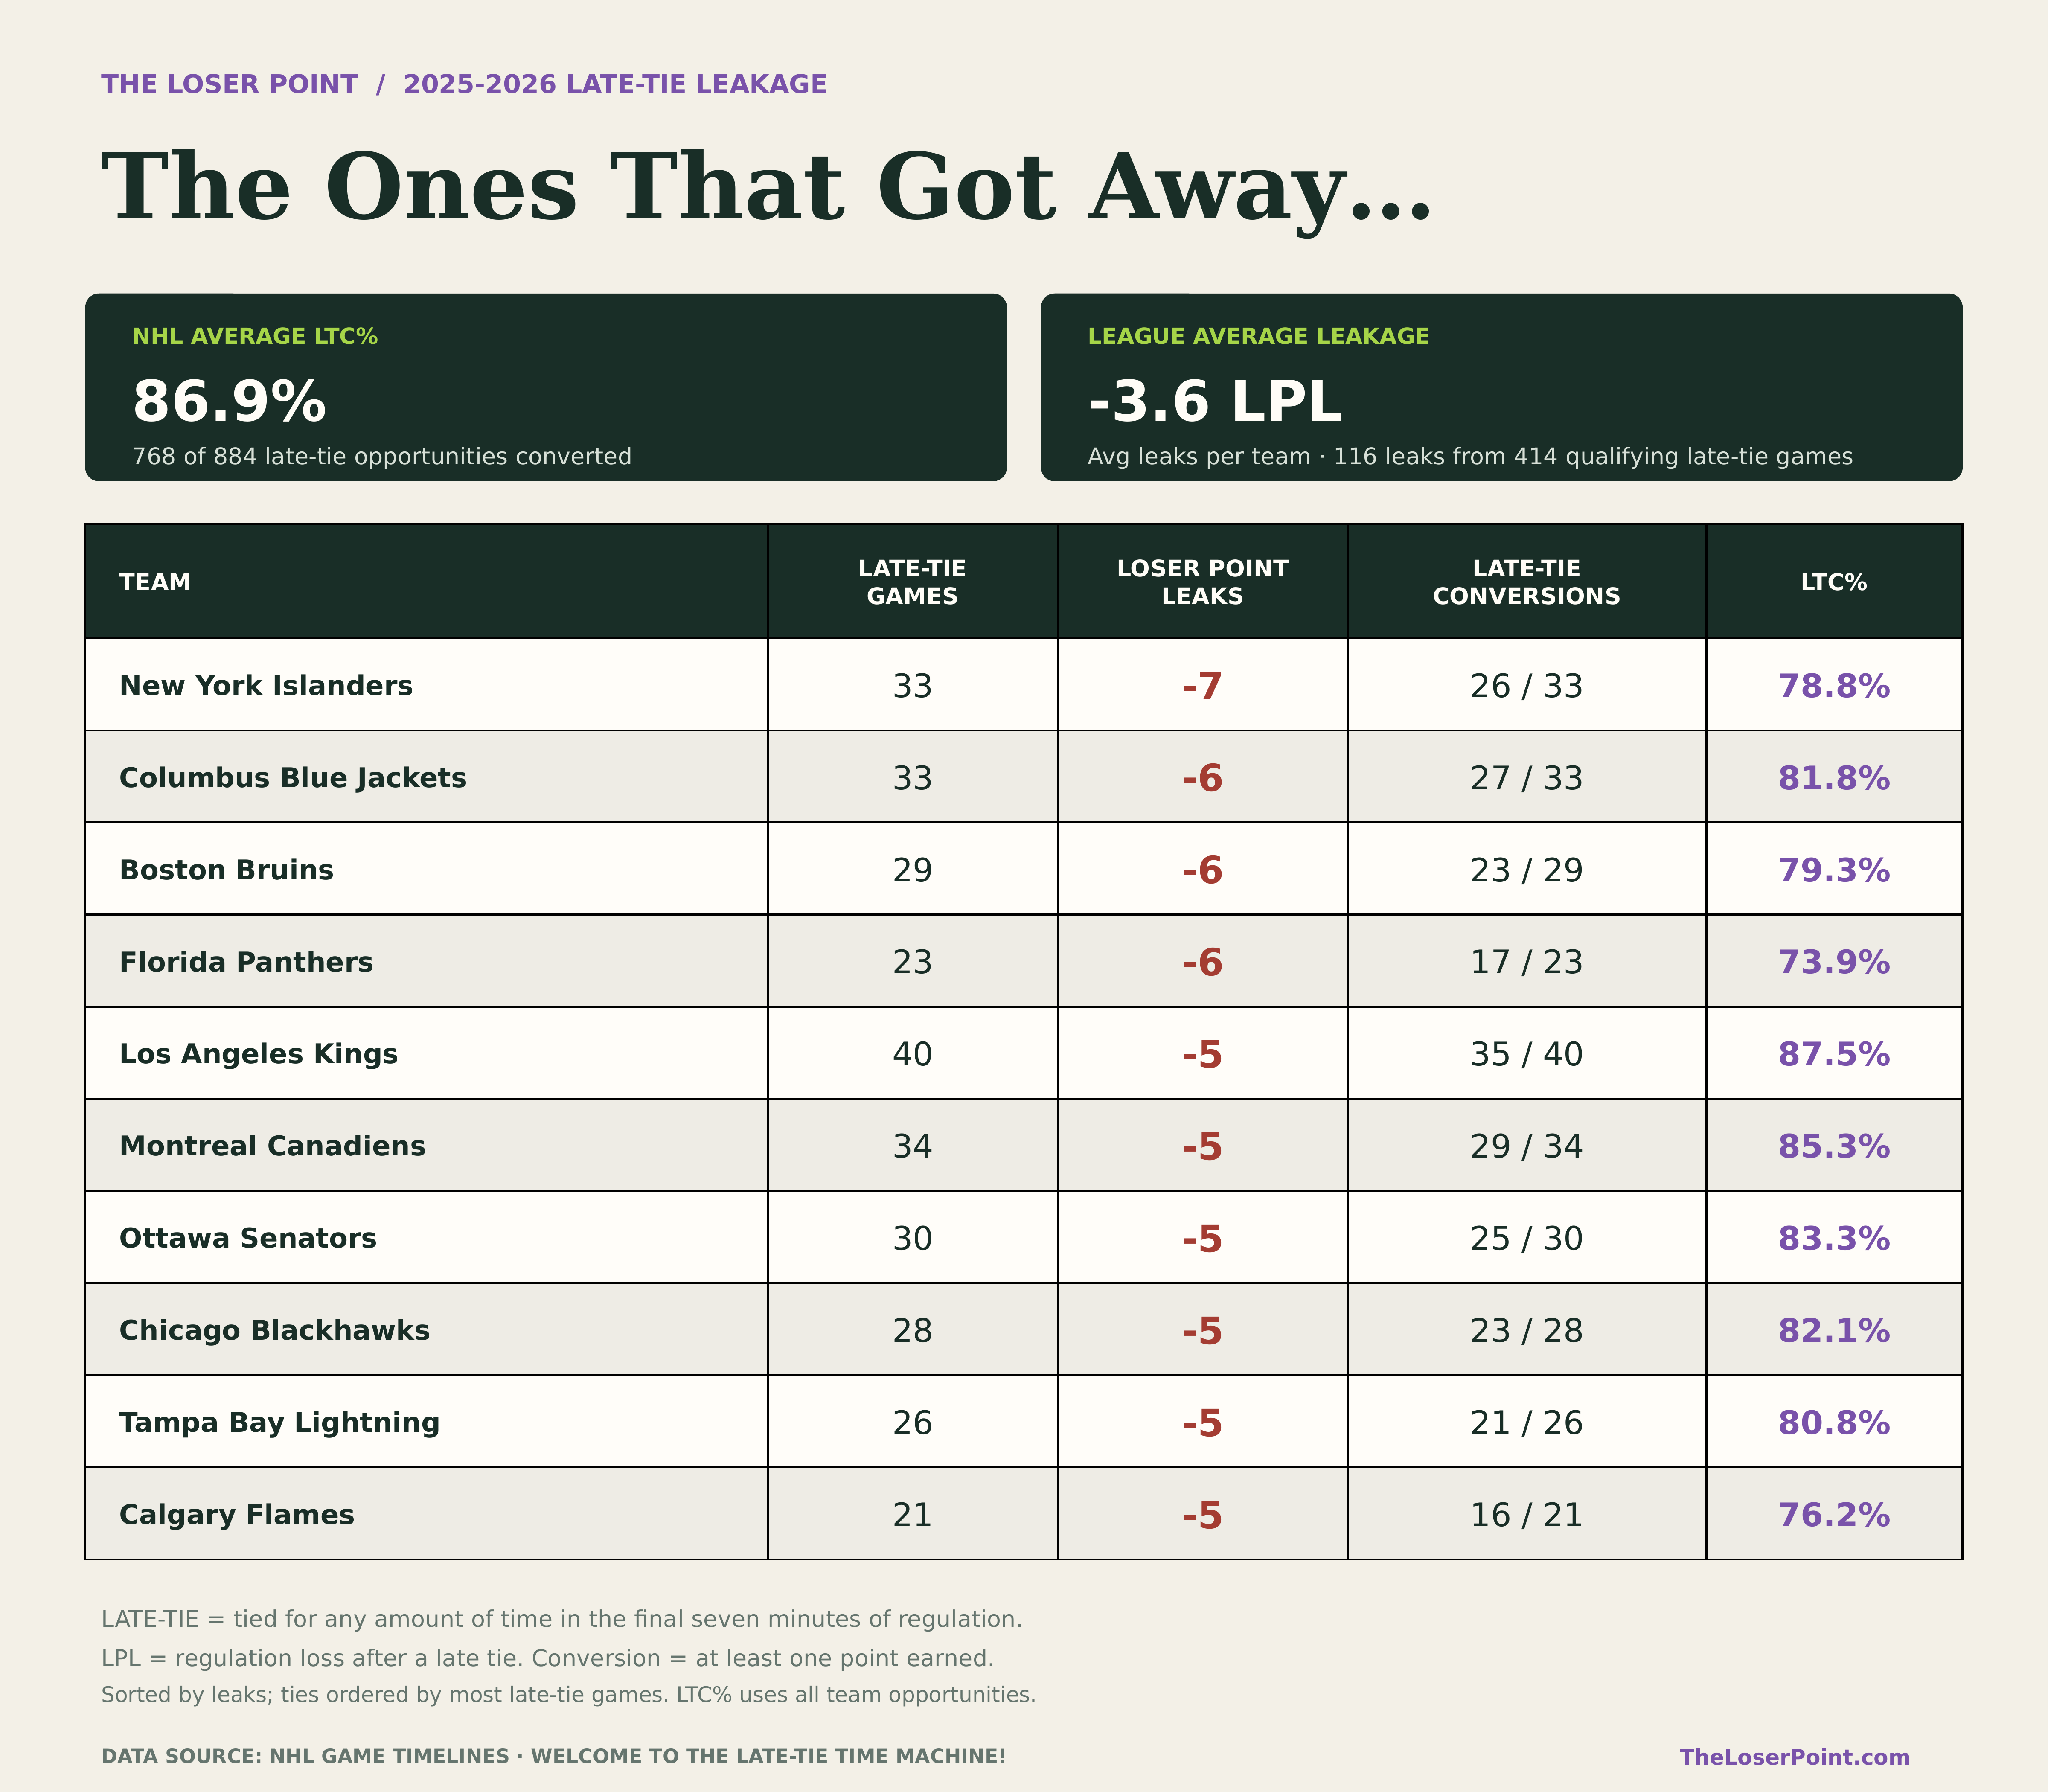
Turns out, other people exist in this world and they also occasionally feel pain and suffering. Who knew!?
Last season saw 442 qualifying “late-tie” games, where two teams were deadlocked at some point in the final seven-minute window of regulation (33.7% of total NHL games). That yields 884 total opportunities for “Late-Tie Conversions” when you factor in both teams on the ice. On 116 occasions (13.1% of total conversion chances), one of those teams decided to shit their pants and toss away a perfectly good consolation point.
That puts the league’s Late-Tie Conversion rate at 86.9% — NHL teams averaged 3.6 leaks per season. Good baselines to keep in mind…
It’s also pretty interesting to note that 326 of the 442 qualifying games wound up going to Gimmick-land — 73.8% of the time, it works every time.
Turns out, I would wish this on my worst enemy…
Last year’s worst offenders list does not, in fact, feature the New York Rangers. Big shout out to that “History of Memory” class I took in college - this one’s for you, Professor Castor!
Despite how I remember it, the Rangers actually sat just below the league average with only 3 loser point leaks all season. Now this is partly due to where we drew the line in the proverbial seven-minute sand but regardless it gives me a way to step back and say - alright, maybe we weren’t so awful at closing out super-tight games to squeeze more consolation points. We were just awful in general. But who was awful at wasting consolation points, exactly?

Well, well, well! If it isn’t those gross, smelly, pants-stained Islanders sat atop last year’s Leaker-board with -7 LPL. Yikes! They also had the third-lowest LTC, behind Florida and Calgary. Their 78.8% conversion rate was significantly below the league’s average after 33 qualifying late-tie games.

So they played a lot of close games and dropped an above average amount of points in those games. Considering their Gimmick Win Rate (GWR) was third-best in the league last year at 73.7%, they probably could have taken the full haul from more than one of those close games — if they had just dragged more of them into OT.
The worst offense has to be March 19 against Ottawa: the Islanders let in the winning goal with 13 seconds remaining. Their season finale against Carolina supplied another leak, with 5:22 left. The fact that they had already been eliminated from the playoffs probably took the sting off that one but in totality, their LPL total speaks to what could have been. Seven extra points would have put the Islanders one back from the final wild card spot.
Speaking of wild — that extra point could have been won via gimmick if they had managed to NOT blow that March 19th tie with 13 seconds to go. Imagine the counter-factual: the Islanders (who in this unlikely hypothetical also don’t lose any of their other leaks in regulation, or get to overtime and manage to win a few of them) beat the Senators in a very lame shootout that proves insanely consequential one month later for both team’s playoff chances. Sliding doors, baby!
Vancouver, You're Gorgeous
On the other side of the late-tie spectrum were the Vancouver Canucks, the only team to make good on every conversion opportunity. Their 100% LTC was earned over 21 late-tie games (second lowest league-wide), meaning their perfect record was maintained through fewer late-tie minutes than most teams had to play through.
The Canucks were objectively awful though. They finished with 58 points, for crying out loud! A terrible, horrible, no good, very bad season. So this example illustrates how LTC% can help diagnose and quantify a team’s reckless behavior when the game is tied late in regulation. But as a standalone stat, it doesn’t necessarily say anything about the team’s overarching quality.

The End Has No End...
I thought that would be that. I’m not even lying - I genuinely thought I’d be done making up ridiculous metrics after “Loser Point Leaks”. The late-tie metrics felt like a natural ending point for The Loserverse, and Late-Tie Conversions brought us a great foil stat for those teams who decide NOT to shit the bed.
But something was still missing…

Bringing In Late-Lead Context: Point Dumps & LLC%
Like I said, I started this blog on Thursday during the Rangers game, but I had planned to finish during Friday’s action. I threw on the Jets-Bruins game after seeing a close score late in the third, and to my delight, Boston equalized with less than two minutes to go - officially triggering The Loserverse.
The Jets, having led for the entire third period before falling prey to a pulled goalie, subsequently lost the game in OT. While I was excited to label this a “loser point” and add it to Winnipeg’s developing xLP equation, it felt weird to leave that game-state context on the table. Jets fans will see that as one point wasted, not one salvaged. So… I did the thing again.

The Point Dump Metrics
Winnipeg’s loss to the Bruins is a prime example of how we can further contextualize a team’s loser point behavior and potentially quantify points lost via letting go of late leads. These are context-based stats, essentially helping us differentiate between a skidmark and a shit-stain.
While the Late-Tie Conversion helps us understand what happens when a game is up in the air for either team to grab, Late-Lead Conversion gives context to which team effectively threw points away.

Double Points Dumps are pretty rare, and every DPD will also show up as a Loser Point Leak since you can’t go from leading late to losing in regulation without first being tied. But no Single Point Dump could be a LPL since SPDs are an OT/SO-based result and LPL is triggered by a regulation loss. Is your head hurting too, or is it just me?

I started this project as a way to contextualize end-of-game results, especially when those games went beyond sixty minutes. We can now work backwards from any final result and diagnose how righteous or consequential it was. We can slice through the standings to understand performance as a matter of points construction, and that gives us a chance to gauge which teams are true contenders and which ones belong in the mushy middle.
But we're not done yet. There's one more layer of late-tie context to unpack. The Loserverse is ever-expanding…
I'm in the process of pulling the data, or should I say goalie, as we speak. Hint, hint. Until next time, happy losing!