The Art of Failing Upwards
Or: a five-year look-back at snatching a point from the jaws of defeat.
Welcome back, loser! Are you excited for a fresh new season of NHL hockey? I clearly am, since I spent the last several weeks designing a website to help track my inevitably terrible Rangers across a series of depressing data points.
And though I’m not exactly excited to watch our lifeless power play units fail at breaking through the neutral zone ten thousand times over the next several months, I’m having too much fun with the site to just sit around and wait for a new sample size to grow.
So I thought we’d look back at some key insights from last five seasons to prepare us for the far-too-many shootouts ahead. What can we learn from previous years that might prove useful? Can this data shine a light on how losing efficiently impacts a team’s long-term success? Is this microphone even on?
Once the puck drops on meaningful hockey, we'll need to ignore the live standings dashboard for a couple of weeks while everyone plays their first 8–10 games. But if we’re going to spend a whole season studying the art of failing upwards, we should have some baseline lessons under our Bauer-branded garter belt. So let’s dive into three key findings from the past five years of loser-ing…
Last Season Broke the Loser-verse
Many will remember the 2025–26 season for its fun stories and positive performances. Buffalo’s emergence after years of toiling in the Atlantic, the Olympics (unless you’re Canadian), Celebrini and the Sharks becoming must-watch hockey despite playing all their games way past my bedtime.
But 2025–26 was historic thanks to other, less remarkable yet statistically extreme performances across the NHL. Zooming in on loser-point dynamics in the post-bubble era, it’s interesting to note that both the best and worst single-season Loser Point Efficiency (LPE) occurred this past season.

Last year’s LA Kings currently wear the crown, pun intended, for the best losers in recent memory with an astonishing 20(!) points earned in games they didn’t win. Tied for second with 17 points are the 2022–23 Flames and last year’s Golden Knights, with three other teams having clocked 16 loser points in a single season: the 2022–23 Sharks, 2023–24 Islanders and 2025–26 Penguins.
So three teams from last year occupy the top six in terms of total loser point inflation, which either says something about league parity or speaks to the surplus of mediocre teams in the NHL right now. Depends on how you describe a half-cup of water…
The Kings were clearly a team that lost their way into the playoff picture. They ended the season with 90 points, 4 above San Jose in the Pacific, so we can look at their +20 loser point inflation and see that a small swing in OTLs could have easily dropped them below the Sharks. But we’ll zoom in on the playoff implications a bit later.
It’s statistically insane for a team to earn 22% of its total season points through losing, taking a point from 42% of the games it lost. This is not a trend Kings fans will want to see carry on into the new year, and it’s likely not a strategy you can repeat on purpose...or is it?

When we look at Loser Point Efficiency, for example, we see the Kings clock in second in the post-COVID era at 42.6% LPE. The rest of the top four — including the 2023–24 Bruins (42.9%), last year’s Avalanche squad (40.7%) and the 2022–23 Dallas Stars (40%) — would all be considered "Genuine Winners" and had significantly fewer total losses than last year’s Kings.
Interestingly enough, sitting at fifth in terms of single-season LPE is the 2025–26 Golden Knights (39.5%), so Vegas and LA clearly pushed the limits last year on how to lose successfully.
Vegas wound up topping the Pacific Division, beating out the Oilers by 3 points — a team with 6 fewer loser points than VGK — and the Ducks by 4, eventually making it to the Stanley Cup Final. Had Anaheim been slightly better than the 28th-best team in LPE, or had Edmonton won a couple more games, Vegas’ playoff path would have been significantly different.
From Kings to Devils
But what about the other side of the loser-verse? Surprisingly, last season also produced the least efficient losing team in recent memory, with New Jersey earning a measly 3 OTL points from a pathetic LPE of 7.5%.

Their paltry loser-point total was relatively in line with the lowest numbers from previous years, with each season’s “worst loser” typically earning only 3 or 4 points.
Now this isn’t a pure indicator that a team is Hot Garbage. Florida, for example, earned only 4 loser points in both 2024–25 and 2025–26; one of those teams missed the playoffs and the other won the Stanley Cup. If you look at the Panthers’ record for those two seasons, you’ll see that the biggest difference between partying on the beach and playing golf in June is the win total — not necessarily the number of OTLs.

But last year’s Devils were indeed Hot Garbage by all metrics. Compared with other historically inefficient losers, they rank as the worst of the worst in single-season LPE. The next-lowest figure was Winnipeg’s 8.3% from 2022–23, but that team made the playoffs and the Devils—not so much.
So why did the two most extreme versions of losing efficiency happen in the same year? The Kings, along with Pittsburgh and Vegas, racked up historically high loser-point totals while New Jersey lost harder than anyone since COVID. Is there a reason why both extremes materialized in the same season? Probably, yeah!
It most likely has something to do with the sheer number of games that went beyond regulation. Last season produced 326 OT games, 55 more overtime or shootout games than either of the preceding two seasons — a 20.3% increase. Holy neutral-zone regroup, Batman!

- Nearly one out of every four games went beyond regulation in 2025–26.
- The annual average was approximately 292 overtime games. Last season finished 34 games above that average.
- The previous five-season high was 302 in 2022–23, so 2025–26 surpassed it by 24 games.
- Especially annoying is that last year produced 119 shootouts, 42 more than the previous season and 17 more than the second-highest total in 2021–22.
- 36.5% of last season’s OT games went to a shootout, the highest percentage in the five-year window, while the previous two seasons were substantially lower at 30.3% and 28.4%.
As we watch this year unfold, we can likely refine our Expected Loser Point (xLP) projections based on the total share of games going to OT.
And despite the evidence that a higher number of OT games likely means more support for TLP’s thesis, I think we can all agree that fewer shootouts this year would be a good thing.
Playoffs!? Playoffs!?
That’s what all these ties are for, right? We're "tying" to make the playoffs! (sorry)
So let’s zoom in on the loser point’s playoff implications and understand how OTLs impact the postseason picture.
This was really the core idea behind creating TLP: would being “better at losing” change the eventual playoff landscape, or is the impact of this dumb consolation point on a team’s final position rather minimal once all 80-something games are played?

It turns out the effect is pretty minimal, which is a good thing if we want our standings to have some kind of structural integrity. But even a modest number of impacted playoff berths, or - more commonly - changes to the seeding, is worth noting here at The Loser Point.
Unsurprisingly, last year’s sharp rise in total OT games, and the extreme statistical performances of specific teams, resulted in the largest single-season number of impacted playoff spots: three!

That may not sound like a lot, but it’s still 18.75% of the league’s total postseason space changing hands based on which team loses best.
Now we’ve already touched on what happened out West, where LA’s legendary losing skills kept them 4 points clear of San Jose. But let’s dive a little deeper into how that played out...
The Sharks missed the playoffs with a demonstrably bad 18.6% LPE (26th overall) and only 8 earned loser points. You have to imagine that, even if LA goes back-to-back as the best losers ever, Macklin is going to drag that SJS squad to a couple more wins this year and bring them closer to the 90-point threshold.
Our sweet Kings went to overtime in 8 of their final 15 regular-season games. Even when they were winning, they felt obligated to give the fans bonus hockey at every opportunity. What swell guys! But is it a sustainable strategy for long-term divisional strength? More on that later...
San Jose, by contrast, dragged only 2 games into OT during its run up to missing the playoffs. Had the Sharks gotten a bit more puck luck in some of their closer games, we could have been talking about Celebrini for MVP, à la Taylor Hall that one year.

In the Eastern Conference, consolation points rewrote two-thirds of the Metro’s qualifying field. The fate of four teams was sealed through loser point inflation (or lack thereof).
Pittsburgh was the most obvious beneficiary. Its 16 loser points and 39% LPE completely flipped the script for a team many expected to be a likely tanker. Without those points, the Penguins’ 41 wins would have left them outside the Metro’s top three. With them, Pittsburgh finished with 98 points and claimed the division’s No. 2 seed.

Philadelphia also needed the loser point to survive an unusually messy tiebreaker. The Flyers, Capitals and Islanders each finished with 43 wins, meaning a wins-only field would have turned to regulation wins to separate them. Washington had 37, the Islanders had 29 and Philadelphia had only 27.
Under that system, Washington and Long Island join Carolina as the division’s three qualifiers, while both Pittsburgh and Philadelphia miss out.

Once loser points are restored, the picture changes completely. Philadelphia’s 12 points earned from losses pushed its official total to 98, while Pittsburgh’s 16 did the same. Washington finished with 95 despite winning 2 more games than Pittsburgh, and the Islanders’ miserable 5 loser points left them stranded at 91.
The official Metro field therefore became Carolina, Pittsburgh and Philadelphia (meaning the Penguins displaced Washington and the Flyers displaced the Islanders).
Pittsburgh’s superior losing ability even affected playoff seeding. Pittsburgh earned it the No. 2 seed and home ice despite being tied with the Flyers at 98 points. Their insane LPE (in addition to their higher number of regulation wins compared to Philly) meant the Battle of Pennsylvania started in Steel Town. Philadelphia winning that series in six games may suggest that, in a world with less loser points, Pittsburgh’s home ice advantage said more about how it accumulated points than how good they actually were.
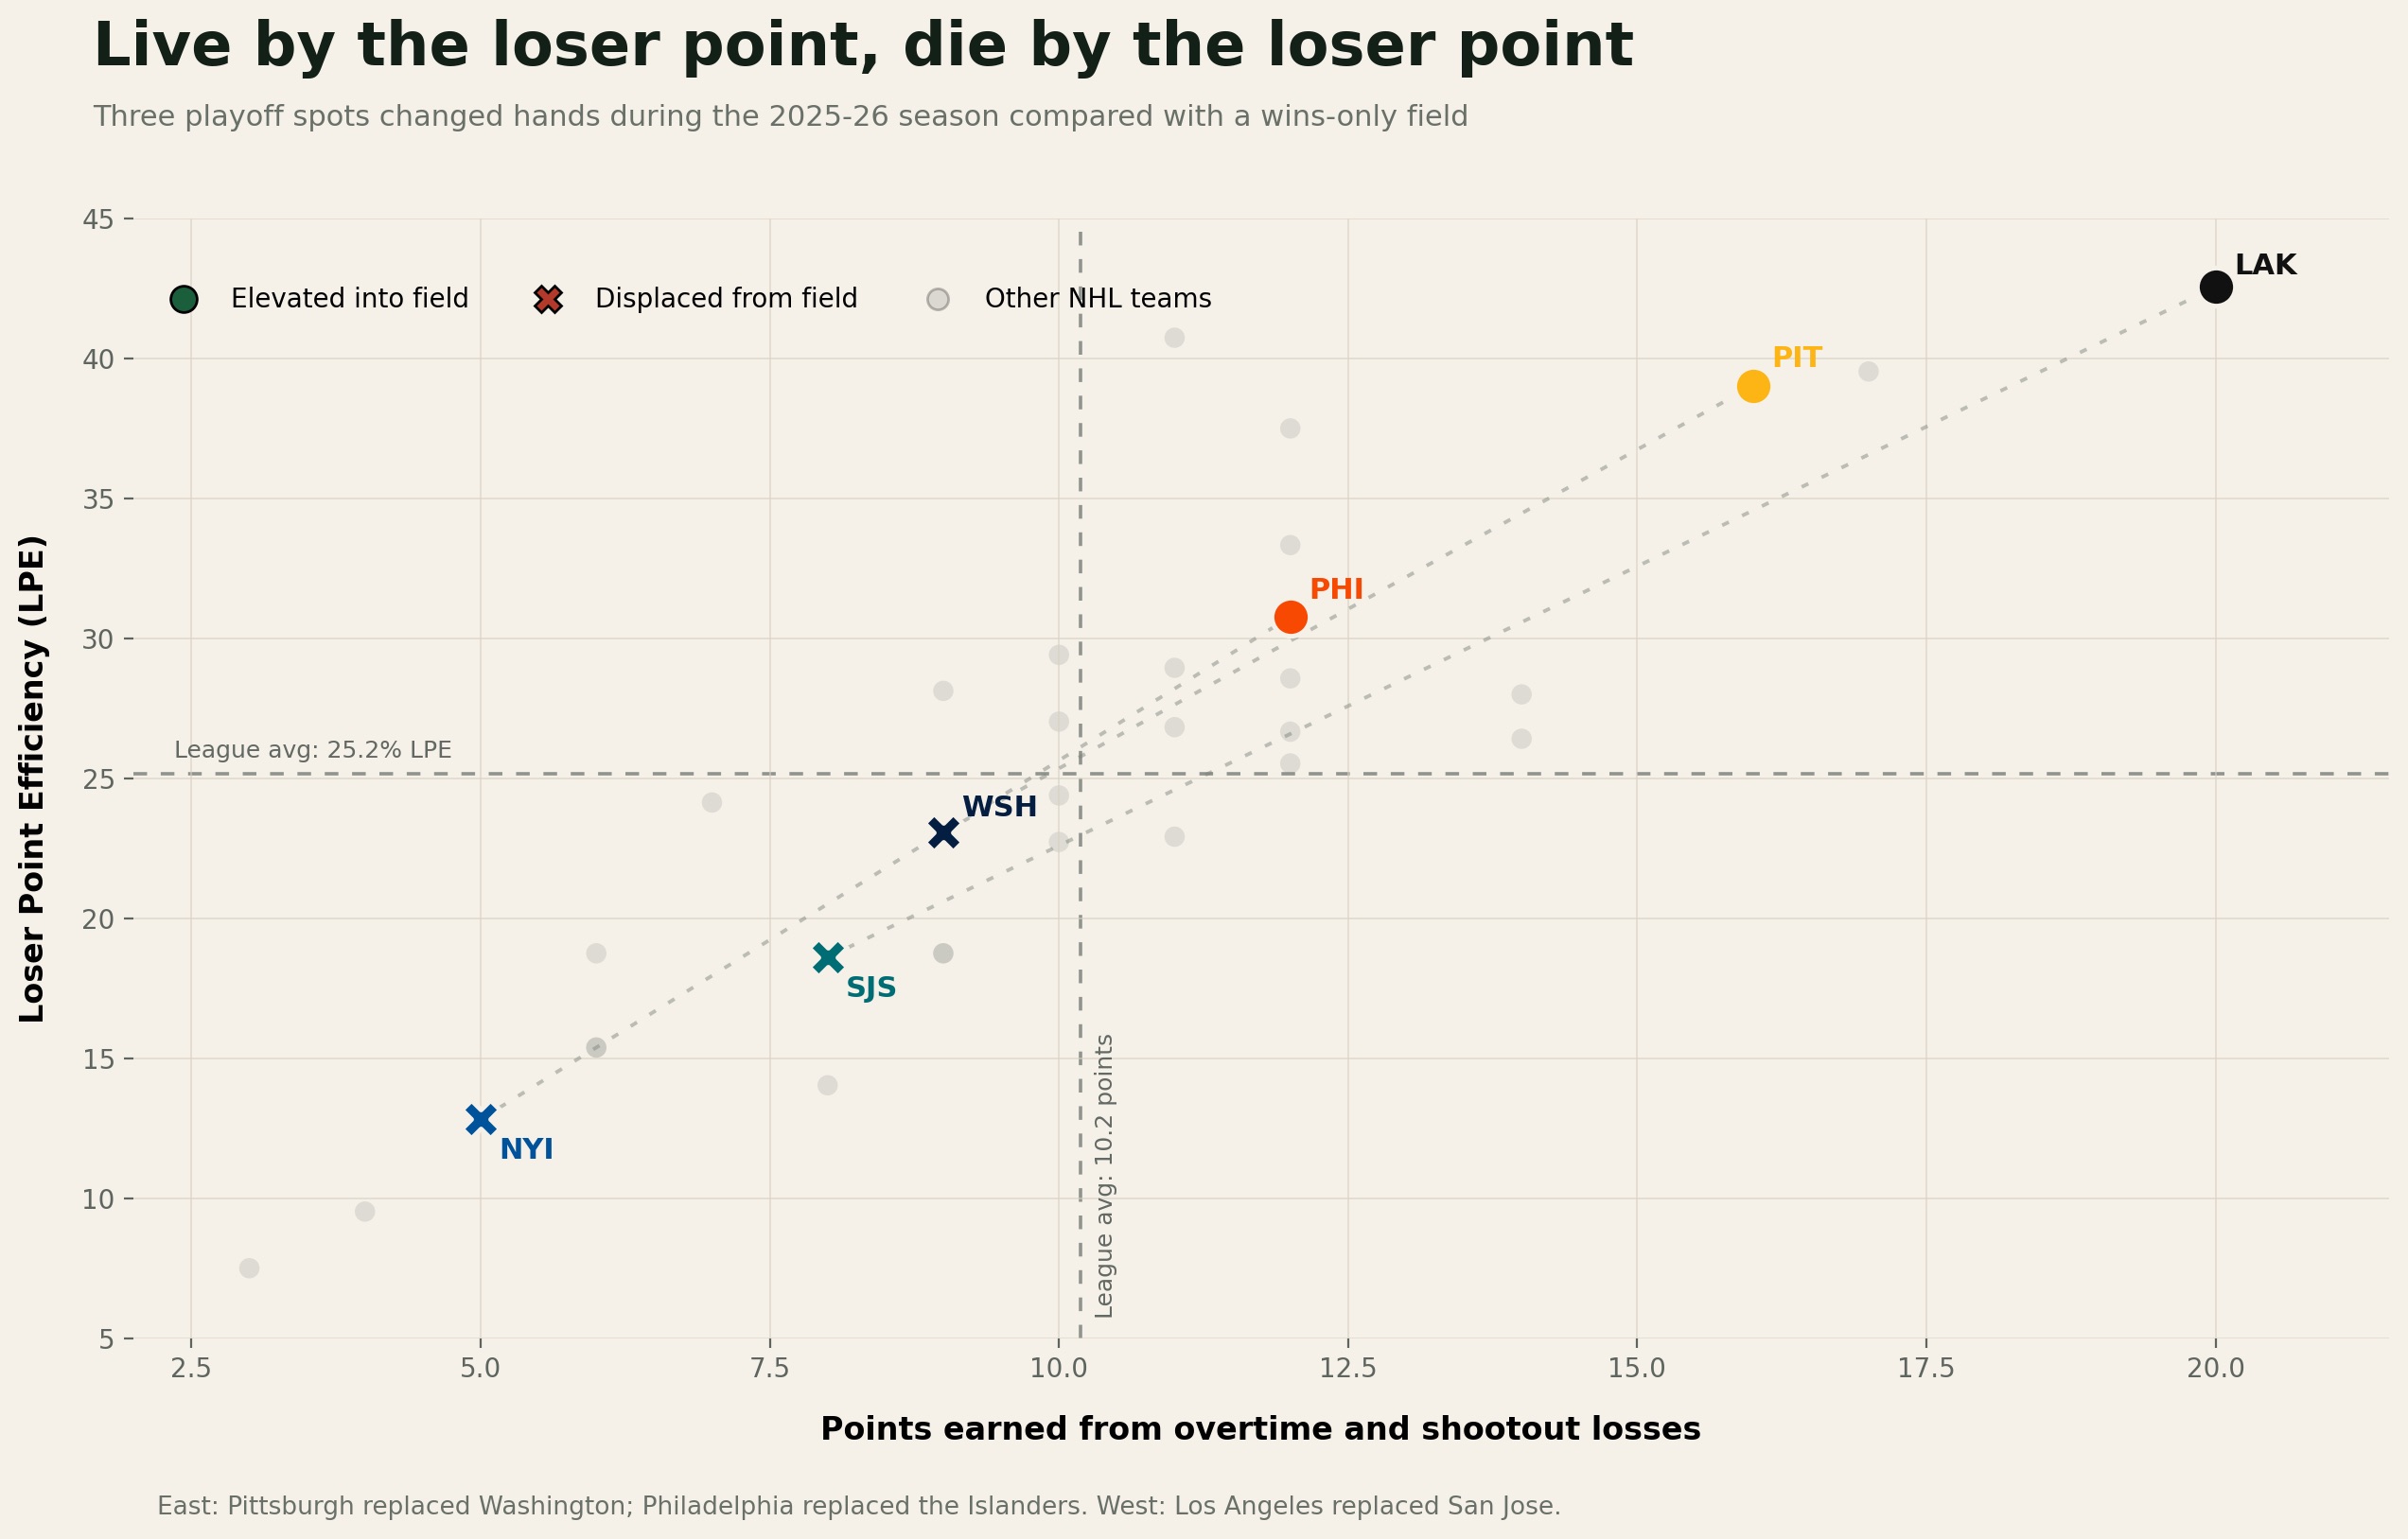
When we plot the six teams involved in the three changed playoff spots, the directional relationship becomes much clearer. LA and Pittsburgh sit deep in the upper-right corner, combining well-above-average LPE with enormous loser-point totals. Philadelphia is less extreme, but still finished above the league average in both measures. All three teams elevated into the postseason field therefore received meaningful assistance from losses that survived past regulation.
The displaced teams tell the opposite story. Washington and San Jose finished below the league average in both LPE and points earned from losses, while the Islanders sit even farther down and to the left after salvaging only five points all season. The chart doesn’t prove that every efficient loser will make the playoffs, but in these three races the pattern is remarkably clean: the teams above the league averages got in, and the teams below them got pushed out.
As this season’s playoff races take shape, we can keep updating the scatter plot to see whether that directional trend holds.
Once a Loser, Always a Loser(?)
The next step was looking at LPE variance from season to season. And the fact is, there’s basically no correlation signal to suggest that losing efficiently is an organizational trait.
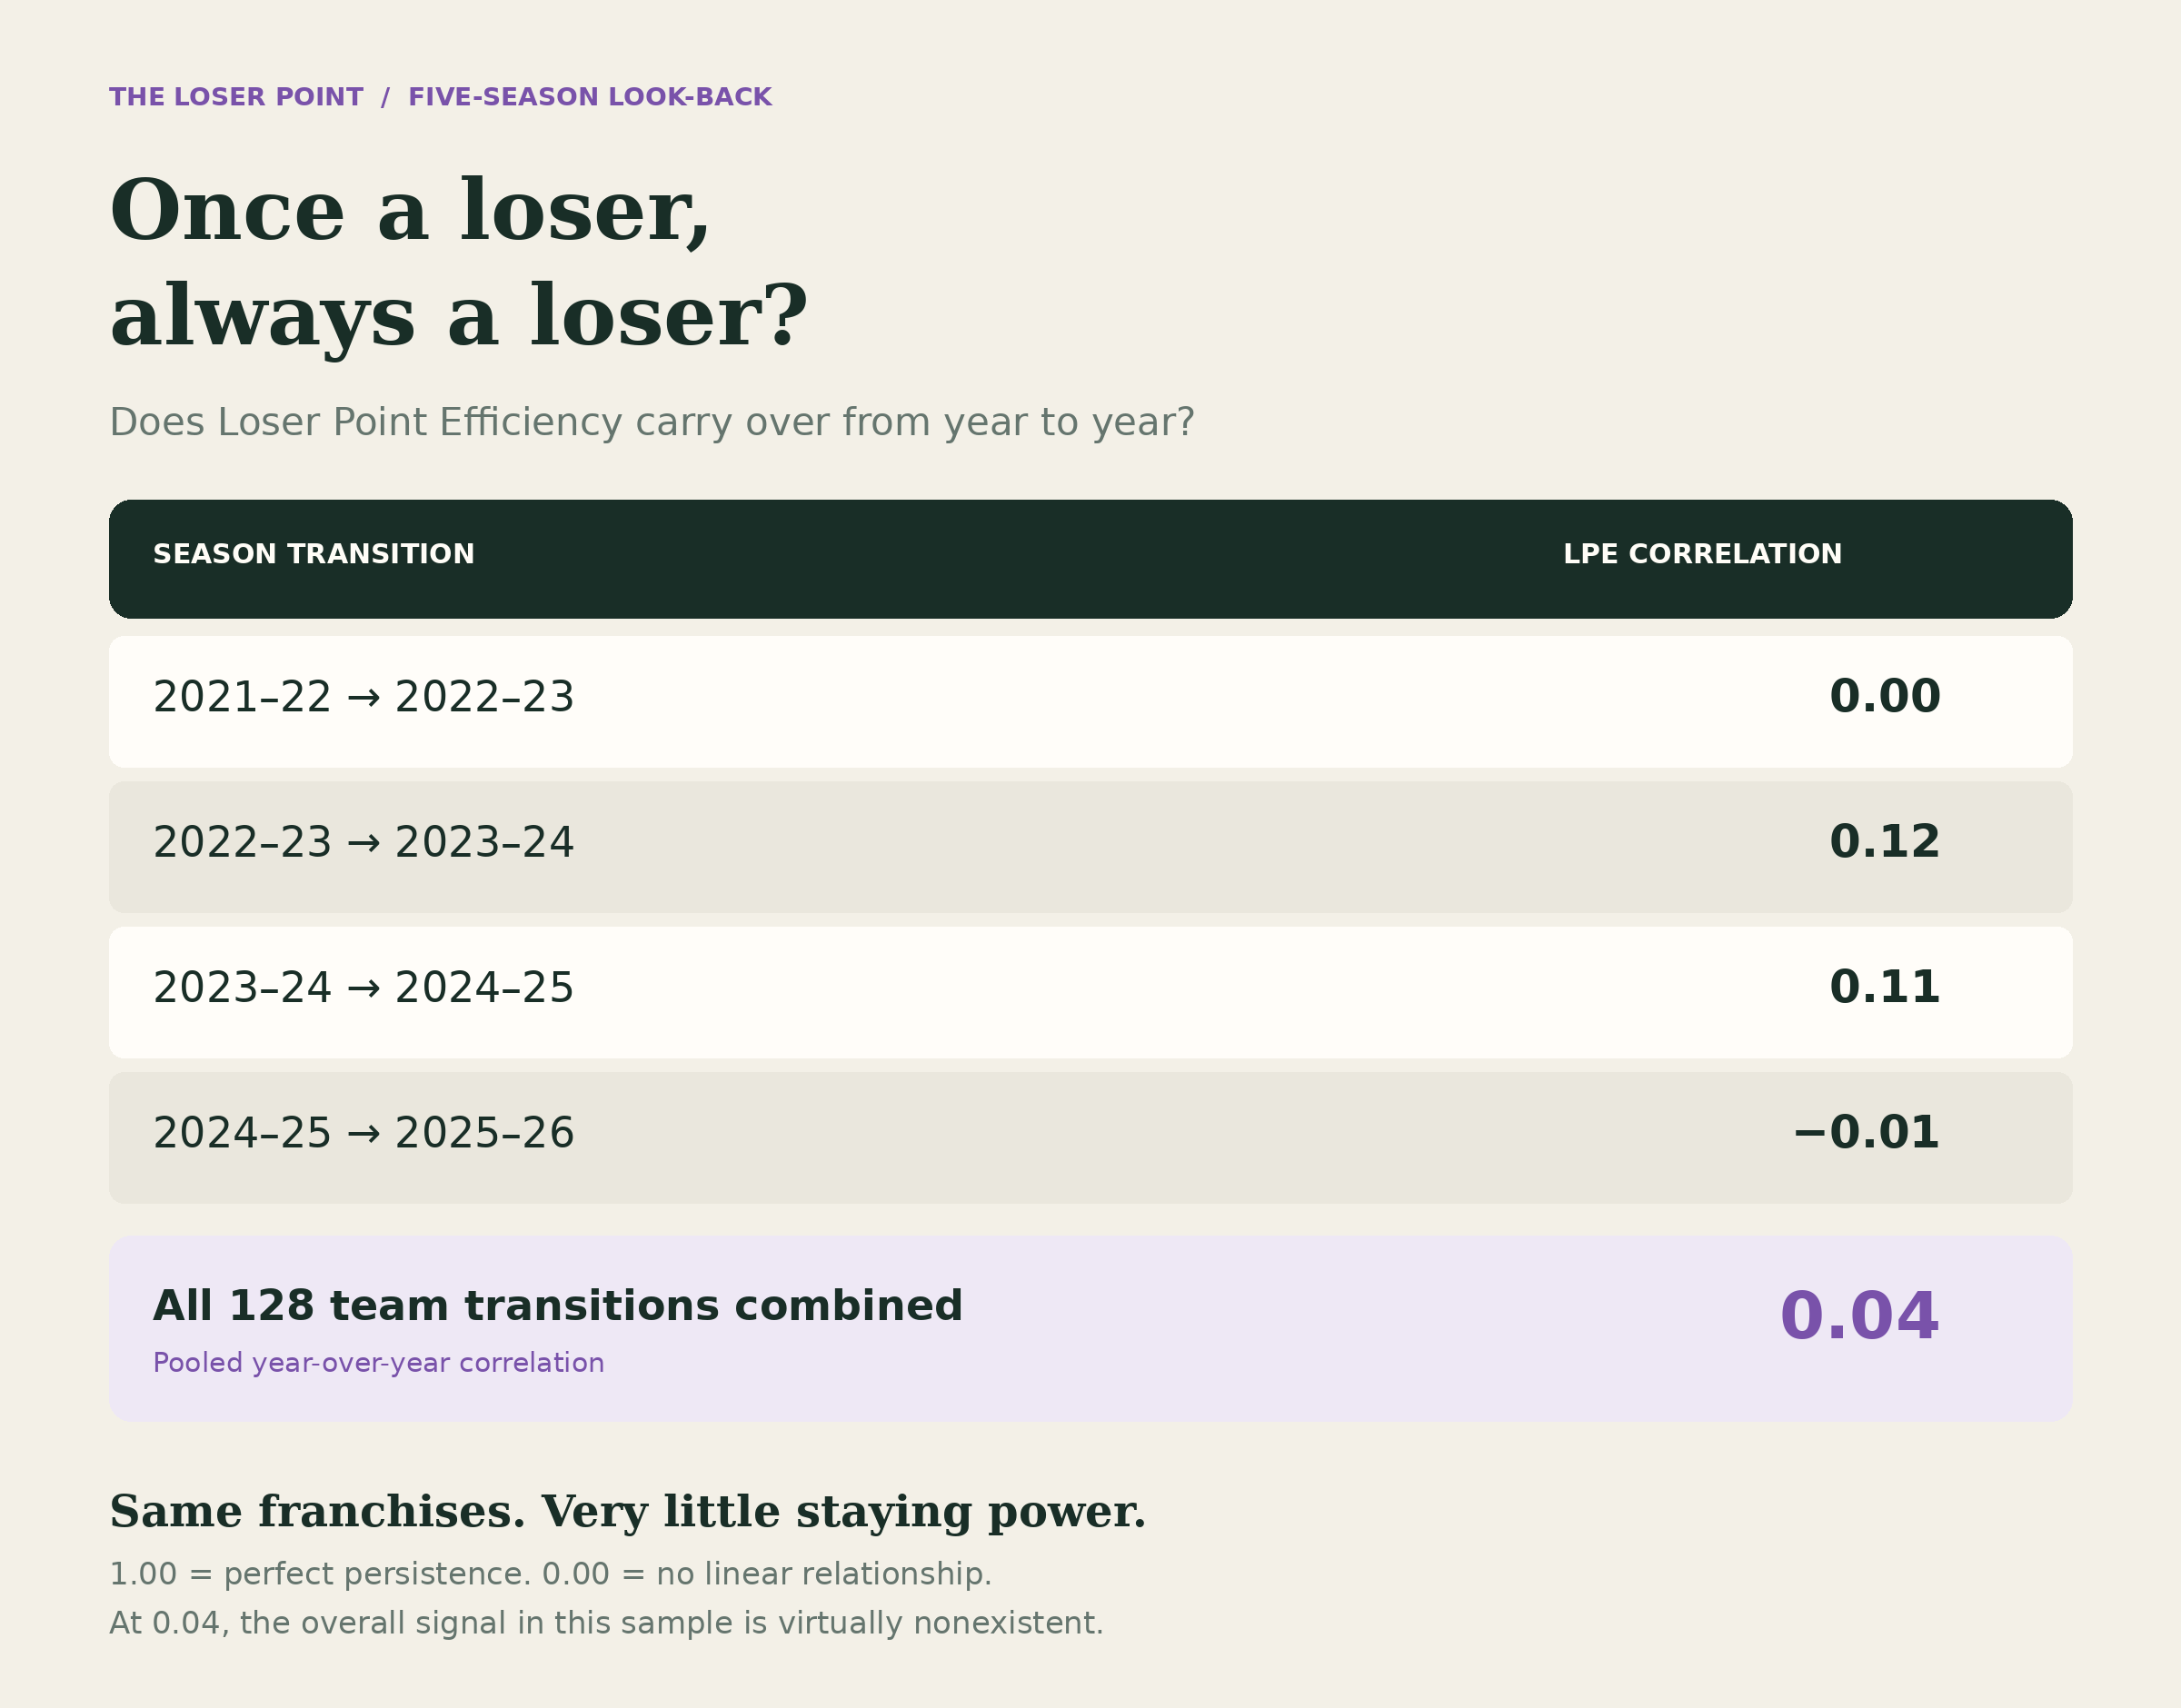
Zooming in on the Loser Profile types tells a slightly more interesting, but still very weak, story:
- Elite Losers remained elite the following season 17 of 40 times (42.5%).
- Non-elite teams became Elite Losers the following season 23 of 88 times (26.1%).
- Only 47 of 128 team-seasons (36.7%) remained in the same category the following year.
So being elite makes another elite season somewhat more likely, but nowhere close to destiny. In fact, teams crossed directly from Elite Loser to Bad Loser—or vice versa—19 times in 128 transitions, nearly 15% of all opportunities.
Category whiplash is the more likely diagnosis year-over-year. Below are some particularly wild LPE swings:
- Colorado ('25–26): 31st → 2nd
- Montreal ('23–24): 31st → 3rd
- St. Louis ('22–23): 2nd → 29th
- Vancouver ('25–26): 2nd → 29th
- Calgary ('22–23 through '25–26): 2nd → 27th → 1st → 23rd
- Dallas ('22–23): 26th → 1st
Calgary’s five-year LPE rankings were 1st, 2nd, 27th, 1st and 23rd.
The Canucks went from 7th to 27th to 6th to 2nd and then back down to 29th.
Those are not indicators of a stable organizational identity; it looks more like a stat that dramatically swings with a few extra overtime appearances or close-game outcomes.
It’s also interesting to note that Calgary, Vancouver and Montreal each finished as "Elite Losers" in three seasons, but also among the "Bad Losers" twice. So a team can be a repeat elite performer without being remotely consistent.
But there are actually two notable exceptions here. Can you guess which teams they are?
That’s right! It’s LA and Pittsburgh, of course!

The Kings have been Elite Losers in all five of the past seasons, ranking 5th, 9th, 5th, 6th and 1st, respectively.
Even more interestingly, that persistence survived coaching turnover. Todd McLellan was replaced by Jim Hiller during 2023–24, and Hiller was subsequently replaced by D.J. Smith during 2025–26. Regardless, the Kings continued losing in overtime as often as possible while still making the playoffs every year.
Pittsburgh provides another cross-coach example. The Penguins ranked among the "Elite Losers" in four of five seasons, including 2025–26 after Dan Muse replaced Mike Sullivan.

At the opposite end of the spectrum, Nashville was a "Bad Loser" in four consecutive seasons, ranking 23rd, 23rd, 24th and 24th before improving only to 22nd. That pattern also survived a coaching change from John Hynes to Andrew Brunette in 2023.
This hints at any possible persistence living above the individual-coach level, possibly in roster construction, deep-seated defensive philosophy, or a team’s tendency to play close games. Or it could be a totally random coincidence!
What We Learned Before We Know Nothing Again
The first few weeks of a new season will create a lot of noise across these stats. One overtime loss can create a ridiculous xLP projection and a brief run of close games can turn a Hot Garbage hockey team into an Elite Loser.
But five seasons of loser-point history gave us a few things worth remembering.

Loser points can change the playoff field — but usually do not.
Only 4 of 80 playoff spots across our five-season window changed when the standings were reconstructed using points generated through wins alone. Three of those came last season, when the number of OT games hit a recent high. So put down your torches and pitchforks: the loser point is not as evil as it looks.
More often, it creates a bit more chaos in the first round by quietly rearranging the seeds. But we'll dive into that topic on another day...
Last season was X-treme!
The Kings produced the biggest single-season loser-point total and the second-highest LPE in our look-back, while the Devils finished at the opposite end of the loser-verse with only 3. Way more games went to overtime so more loser points were in the mix. We should not assume last year’s headlines represent the new normal.
Efficient losing is not repeatable (unless you're LA).
Year-over-year LPE correlation was almost nonexistent, and nearly two-thirds of teams changed categories the following season. The Kings may genuinely possess some strange institutional knowledge about losing correctly. Most teams appear to be winging it.

So as the new season begins, remember that xLP and LPE should be treated as descriptions before they become conclusions. The numbers will tell us who is rescuing points, who is wasting competitive losses and who is using OT to construct a record more respectable than its win total.
We just might need more than ten games for those numbers to stop being completely insane.
Less than a week until the puck drops. Who’s excited?