OK, Let’s Talk About Gimmick Wins
All my homies hate three-on-three and the shootout
Welcome back to The Loser Point blog, where we make up for the lack of pop-ups and banner ads by inserting way too many gifs!

I thought I’d be writing here maybe once or twice a month, keeping things light and not taking it too seriously. Now look at me, three posts in a week’s time, sharing the blog on Reddit and getting overly defensive about the responses. We are so back, baby!
Now this might shock you, but the majority of comments had absolutely nothing to do with any of the site or article’s content. It was like they saw the word “loser point” and were too filled with righteous indignation to engage with the actual data. Some Redditors were so offended by the moniker that they heroically declined to read the article before downvoting me to death.
I will continue to reiterate: this is not a serious website. This is statistical satire — a deliberately overengineered investigation into a points system that we all seem to agree is pretty dumb, regardless of which side you see as standings inflation. The fact that we can argue all afternoon about whether the third point belongs to the loser or the winner is, in fact, part of the joke.

I'm pretty sure we're talking about two different sides of the same coin, but no matter! In an effort to grow as a person and be less sensitive in the face of online commentary, I’ve decided to embrace the underlying criticisms and see if we can incorporate some of Reddit’s thinking into our TLP worldview.
Most of the upvoted comments centered on two main counter-arguments. So we’re going to walk through each one, discuss how valid it is, and whether it should change the way we view the data points…
“It’s a tie point, not a loser point”
Seems like people are really attached to the idea that each team should get a point if regulation ends with the score tied. That’s defensible, I get it. There’s justice in that math, and some history behind it as well.
Here’s the problem, though. Technically speaking, there are no ties in today’s NHL. That’s a fact — no game ends in a tie. Just the way Bettman likes it! One team wins, one team loses. And sometimes, both teams get at least a point.
The real underlying “issue”, if you want to call it that, is that not all NHL games are worth the same. Some games offer two total points and some games offer three.
Regardless of how you feel about how OT is decided, the current system creates space to study the effects of that inconsistency. I’m not here to argue whether it’s right or wrong, heads or tails. Again, it’s just the reality of the current system.
Feelings aside, I thought it would be fun to walk through each era of NHL overtime rules to understand exactly how historically accurate this argument really is. As it turns out, giving a point out to a team that ends the third period tied is not as timeless as you think…

- The Original OT Era (1921-1942): regular-season overtime existed in various forms, including a full 10-minute period in later years. If extra time ended with no one scoring, both teams got a point. But if one team eventually scored, they earned two points while the OT losers took home nothing.
- The Tie Era (1942-1983): no regular-season overtime at all. If the score is tied at the end of 60 minutes, both teams earned their point and that was that. So we had 40 full seasons of “a tie gets you a point”; it was clean, rational sporting logic, but ultimately not ideal from an entertainment perspective.
- The Win-or-Tie Era (1983-1999): when the score was even after three periods, teams played a five-minute, 5-on-5 sudden-death OT; the game could still end in a tie if no one scored, with each team getting one point. But again, like the OG Era, if one team scored in those extra five minutes the other team got nothing. Ties still existed, but no points for a loss in OT.

- The Loser Point Era Begins (1999-2004): the league moves to a 4-on-4 overtime format, which people seem to agree is “not real hockey”. Ties remained a possible outcome if the game wasn’t resolved in OT. But if it was resolved — say, by one team putting a puck into the other team’s net — the other team still gets a point.
- The Shootout Era (2005-2015): ties are now officially no longer a thing. Every game decides a winner, but if it’s not done during the 4-on-4 overtime then it’s handled in a shootout. Real puckheads all agree that shootouts are lame, much in the same way real music nerds feel very safe shitting on Coldplay.
- The 3-on-3 Era (2015-Present): the rise of 3-on-3 as an alternative option for 4-on-4 is heavily rooted in the fact that people just want less shootouts. And even though it typically produces more exciting gameplay than the previous overtime format, teams quickly learn how to bore fans to death with endless neutral zone regroups. Everyone gets at least a point.
There have been 68 total seasons in which regular-season OT was available in the NHL. Only in the last 26 have we been rewarding a point to the team that loses in overtime (38.2% share of OT-available seasons).
The Tie Era obviously changes that, and definitely affects the way people currently feel about what’s been “earned” after 60 minutes. That era accounts for 40 full seasons of ties-only hockey - 37% of the NHL’s history, all of them before I was born.
But if you add the Loser Point, Shootout, and 3-on-3 eras into the equation then, mathematically speaking, we’ve been rewarding a point to each team tied after regulation for 61% of NHL seasons. There’s precedent before the Gimmick Age dawned, sure, but it’s really not as ancestral as you might think…
“The real gimmick is the OT / shootout win”
OK, so let’s approach this whole statistical farce from the opposite angle. I do think there’s a ton of merit in saying that neither 3-on-3 nor the shootout resolves a game with 100% integrity. Fact is that the shootout is what sparked the change from 4-on-4 overtime, with many people hoping that fewer players on the ice in OT would result in fewer breakaway contests.
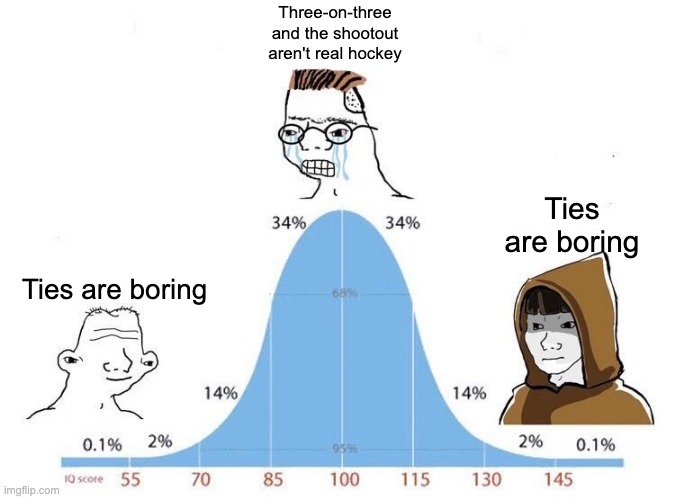
We all agree that shootouts are less than ideal, so to counteract the gimmicky nature of it rewarding an extra point we’ve embraced an even more gimmicky form of overtime. A veritable Gordian knot of gimmicks!
I can understand why people describe the bookkeeping that way: one point apiece at 60 minutes, then a bonus to the winner. I’m not here to fight over which point is “magically created”. The observable issue is 2 total points are available in a regulation game, 3 in an extra-time game.
Most people agree that “3–2–1–0” fixes that while preserving a point for the team tied after 60, but there are sites doing those hypotheticals already. I wanted to approach it from a humorous angle, even if I personally would rather see the NHL adopt that more consistent system.
And even though the league currently provides some minor incentive to win in 60 minutes (given that Regulation Wins is the first tie-breaker), the fact is that a 5-0 beat down earns a team two points the same way a dinky shootout win does.
This definitely deserves its own analysis. If we’re measuring the science of losing in the OT+SO era, then we should probably study the dark art of winning too.
Expected Gimmick Wins (xGW): projects the number of victories a team will collect through overtime or shootouts across an 84-game season.
xGW = (OTW + SOW) ÷ GP × 84
Gimmick Win Dependency (GWD): the percentage of a team’s total victories that required overtime or a shootout.
GWD = (OTW + SOW) ÷ total wins × 100
Approaching it from this angle doesn’t make the loss-side accounting disappear. The overtime or shootout winner gets the same two points as a regulation winner. The extra point added to the league standings goes to the loser.

In my eyes that’s equally as valid an argument as the “ties should count” crowd has, but it’s fair to question whether an OT or shootout win should carry the same analytical weight as a regulation win when we judge team strength.
This gives us direct conceptual foils for The Loserverse metrics, and an opportunity to quantify “success” in the age of gimmick wins:
- Expected Loser Points (xLP): How many projected points come from non-regulation losses?
- Expected Gimmick Wins (xGW): How many projected wins come from less righteous victories?
- Loser Point Efficiency (LPE): How frequently does a team rescue a point from games it loses?
- Gimmick Win Dependency (GWD): How frequently does a team need extra time to finish its wins?
Soon our new homepage layout will incorporate these two new metrics. You’ll be able to jump back and forth from the “Loser Point Leaderboard” to the “Gimmick Win Standings” to better understand who’s over-leveraging OT. We’ll also fold these data points back into our team profiles and expand those pages a bit to account for this new lens on overall quality.

But wait! There’s actually a lot more below on how gimmick wins have impacted the NHL during our five-year look-back window so don’t click out just yet…
Some Wins Are More Equal Than Others
So how does the All Ties Matter narrative change the way we think about “Genuine Winners” and “Elite Losers” in today’s NHL? How would “Ties Era” math change the 2025-2026 playoff field? Let’s jump through a couple counterfactuals from last season to understand which teams were macro-dosing OT wins.

Anaheim (39.5% GWD) & St. Louis (10.8% GWD)
Last season’s Ducks won a total of 43 games, but only 26 of those in regulation. Their 17 OT+SO wins was the league’s highest “gimmick win lift" (a term to describe the end-of-season xGW metric); nearly two in every five Anaheim wins needed extra time.
Obviously, the Ducks made the actual playoffs. But under “tie era” rules, those 17 games are only worth one point each, giving the Ducks 26 wins, 23 ties and 75 points. They go from a Pacific Division playoff team to missing the field. It’s a sharp illustration of what GWD can reveal, even if it reflects a universe that never did and never will exist.
The most useful comparison in this standings experiment is St. Louis. The Blues had fewer official wins than Anaheim (37 to 43) but won more in regulation (33 to 26). Only four Blues wins came after regulation, an admirably low 10.8% GWD. Their 82 tie-era points put them into this hypothetical Western bracket as a wild card (which admittedly was not a thing that existed in the 1970s but that’s beside the point here…)
These counterfactuals get pretty messy so it’s not really as simple as saying that Anaheim displaced St. Louis directly (there are some weird Utah and San Jose implications in the mix that just aren’t worth getting into). The more precise statement is: when the entire Western field is recalculated using tie-guy math, Anaheim exits and St. Louis plays on.

Philadelphia & Washington
The Flyers are the East’s version of a similar story, with an even better rival for comparison. Philadelphia and Washington each finished last season with 43 official wins, but 16 Flyers wins came in OT or a shootout versus 6 for the Caps. If we stopped those games at the end of regulation and sent everyone home to kiss their sister, those records become:
- Philadelphia: 27 wins, 27 losses, 28 ties = 82 points.
- Washington: 37 wins, 30 losses, 15 ties = 89 points.
Philadelphia’s 28 ties are a huge part of the story here, too. Twelve came from games the Flyers eventually lost after regulation; in this scenario, they would retain a point for every one of those. But if the 16 games they eventually won on Gimmick Mode no longer provide a second point, Washington would finish seven points ahead.
In the real standings, Philadelphia’s 98 points secured a Metro playoff place and Washington’s 95 left the Capitals out — we already touched on this race in our deep dive on the “loser point” impact.
But if we completely removed the “gimmick point”, Washington would have been third in the Metro, Philadelphia would have missed the playoffs, and Sid would have faced Ovi in round one.
Can’t you just feel the purity?! Imagine this utopia of a world without gimmicks! And all it would have cost us was watching 326 games end in a tie…

Those Damned Kings Again!
If you assumed “remove gimmick wins” meant we wouldn't have to talk about our Loser Point Kings you’d be dead wrong. In this scenario, LA’s 13 OT/SO wins become ties - reducing its 90 official points to 77. But those 20 OT/SO losses also become ties, and those 20 points stay put. The Kings’ 1970s-style record is a bizarre 22–27–33.
That would have been enough to finish third in the Pacific: ahead of Anaheim’s 75 PTS and San Jose’s 74 PTS. LA therefore still makes the playoffs, though its route changes. Instead of entering as a wild card and drawing Colorado, the Kings would have taken a divisional spot and drawn Edmonton… again.
LA marks the spot where the two halves of TLP’s thesis meet. The Kings won relatively few games in regulation, but ended the third period tied an extraordinary 33 times. The gimmick-win bonus helped them in the actual standings; the point for tying helped them survive even after that bonus was removed.
For LA, “loser points” and “gimmick wins” are really just two outcomes of the same underlying habit: taking games beyond 60 minutes.
Same Guests, Different Seats
The most useful finding is that extra-time wins affect who gets in less often than they affect who plays whom. For all the noise we make about loser points and gimmick wins, they usually don’t rewrite the entire playoff field. The teams that were comfortably in tend to stay in, and the teams that were nowhere close remain free to book their tee times.
The more common effect is a rearranging of the seeds: a point here or an extra-time win there can change who finishes second or third in a division, who gets home ice, and who draws who in the first round.
We may give that particular mess its own closer look down the line, but it feels like the type of thing that will become less interesting the closer we examine it…

Natural Born Winners?
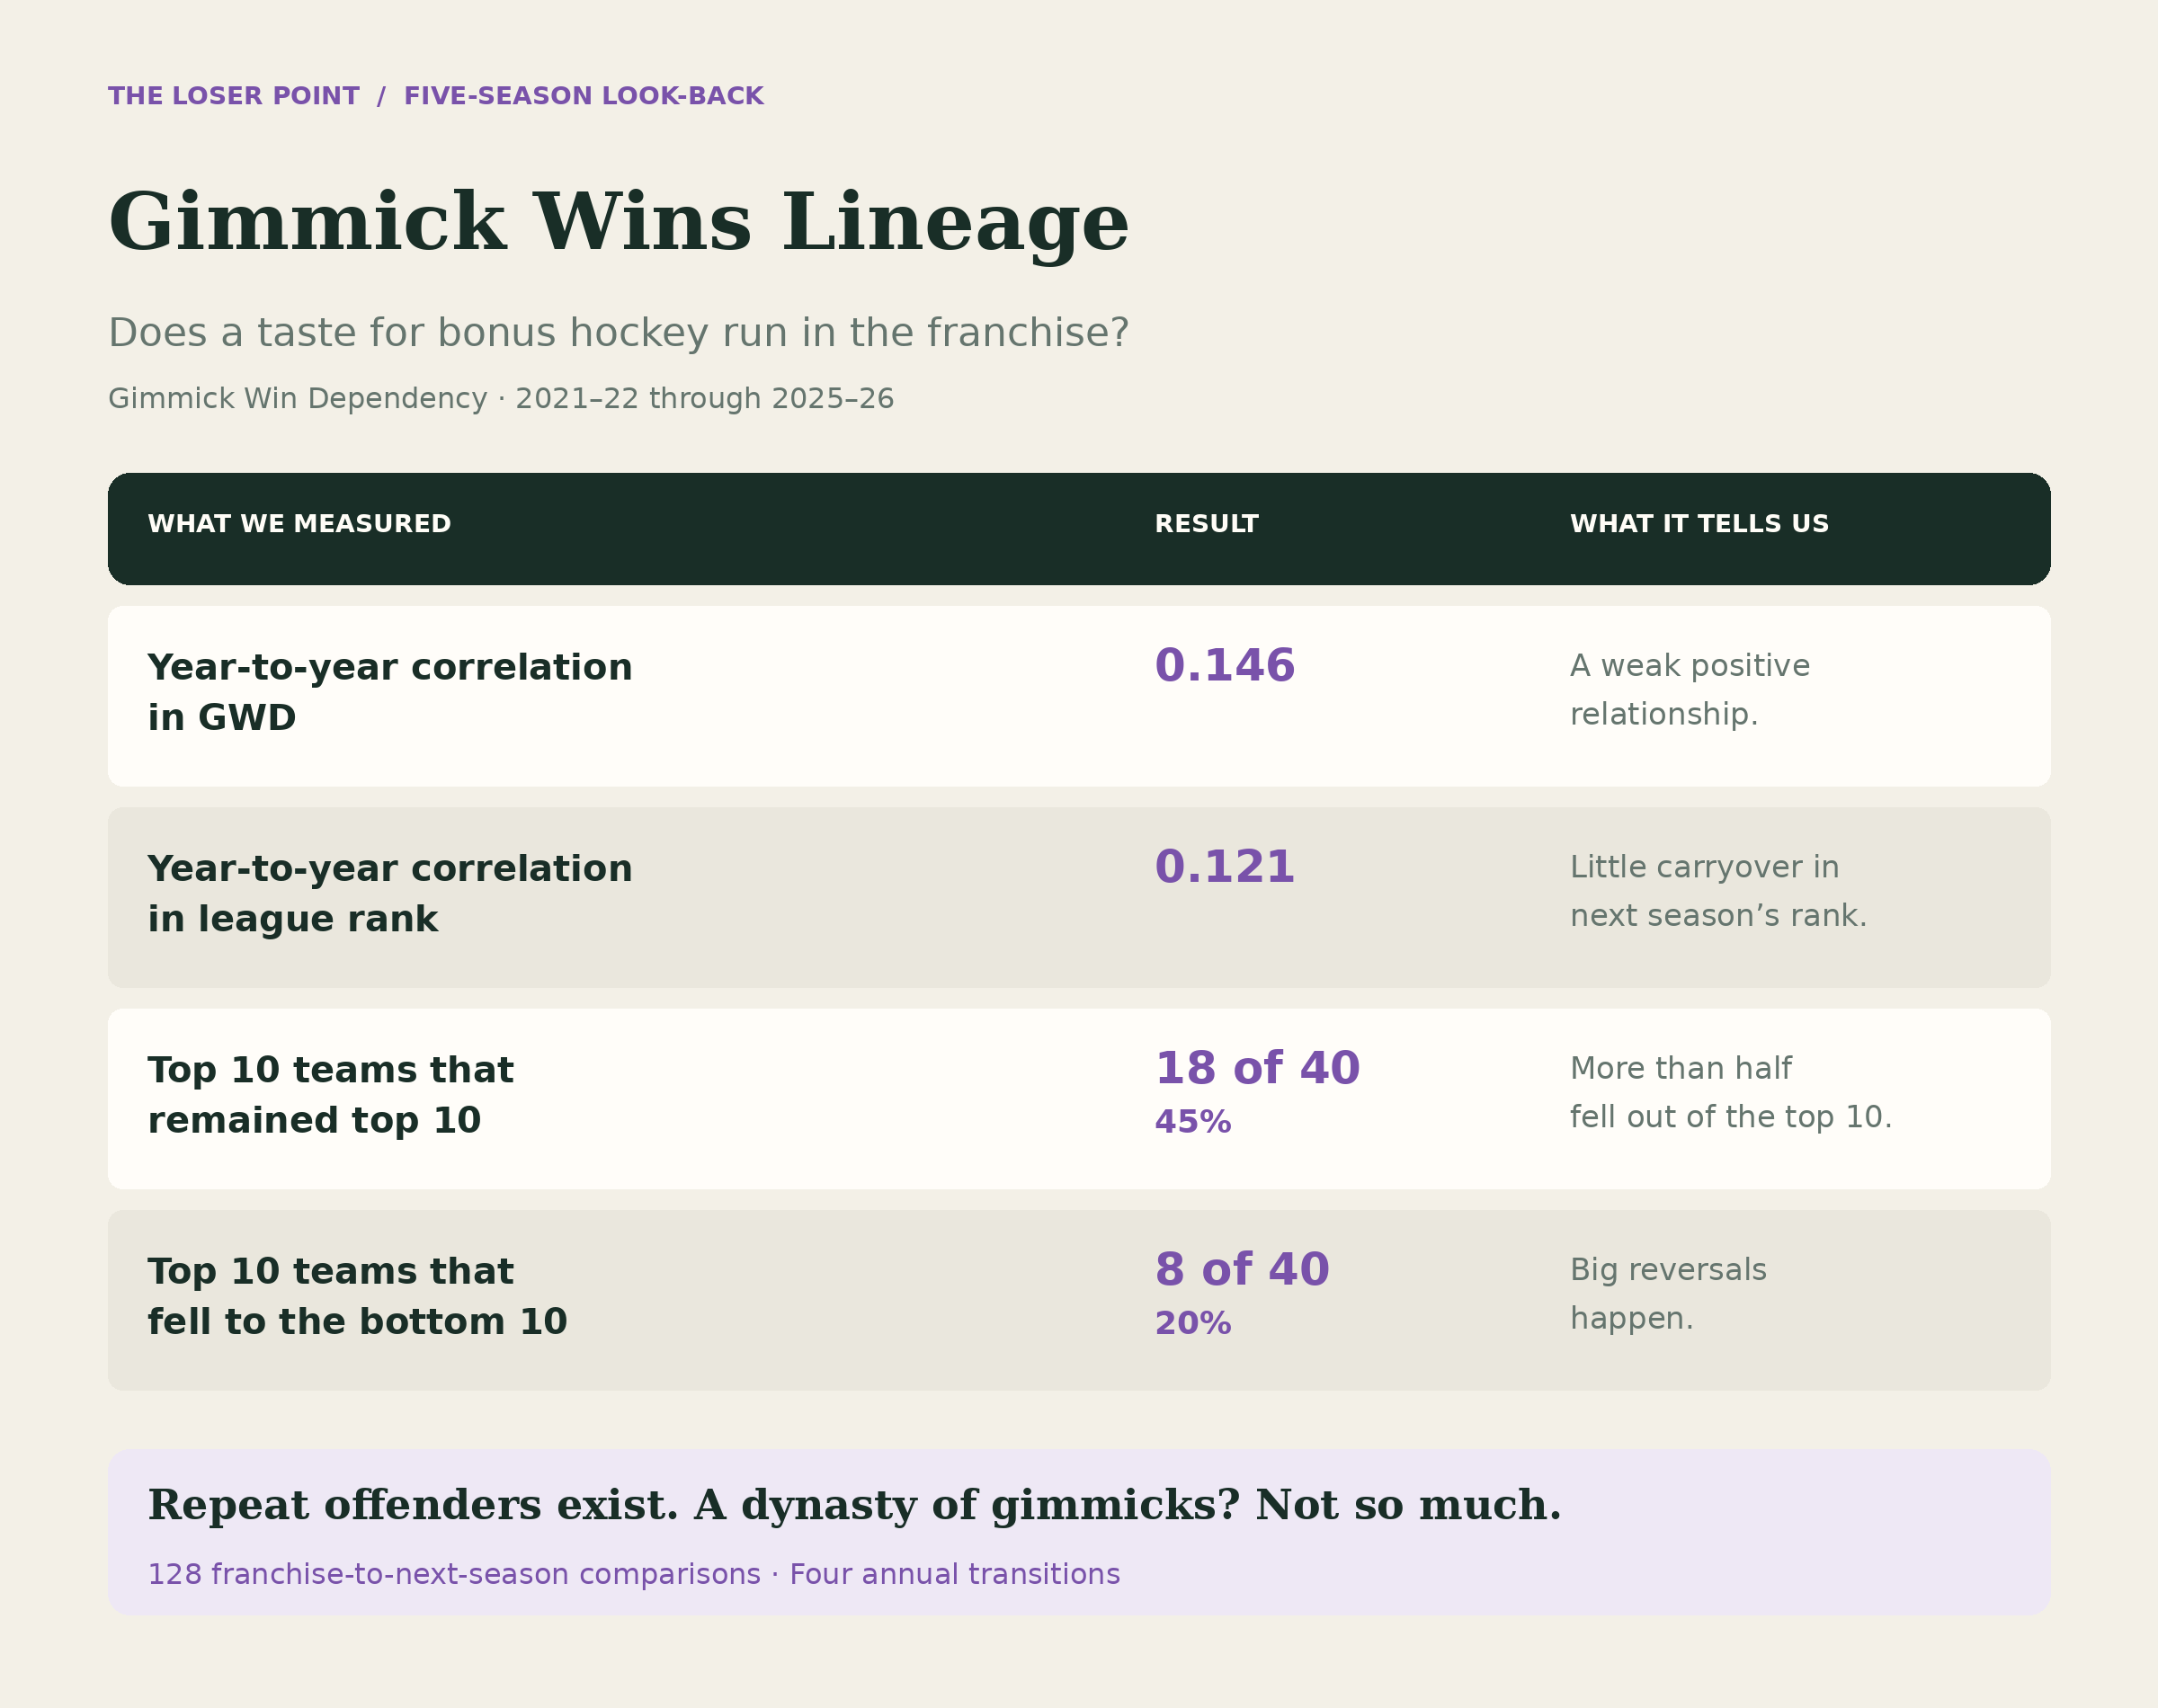
Similar to the correlation analysis we ran across each team’s Loser Point Efficiency (LPE), our next step was drilling into their Gimmick Win Dependency (GWD) numbers from season-to-season as a way of understanding how consistently an organization can leverage OT/SO to earn victories.
Across all 128 team-to-next-season comparisons from our five year look-back, GWD had a weak year-to-year correlation of 0.15. Eighteen of 40 top-10 teams remained top-10 the next season, while eight fell all the way to the bottom 10. While there are some repeat performers, the trend is nowhere near consistent enough to treat a high GWD as a dependable organizational trait.
However, there are some notable team-specific call outs worth mentioning:
- San Jose: top 10 in GWD in all five seasons.
- Anaheim, Columbus, and Montreal: top 10 in four of five.
- Philadelphia: 28th → 16th → 1st → 3rd across the last four seasons.
- Los Angeles: 30th → 4th from 2024–25 to 2025–26.
- St. Louis: 5th → 32nd over that same two season span.
But GWD only measures dependence on extra-time wins, not how good a team is at extra time. A team like San Jose can rank super high because a large share of its wins came after regulation, even while winning relatively few games overall.
To parse this out even further, we made up another completely ludicrous metric:
Gimmick Win Rate - the percentage of games reaching overtime or a shootout that the team won.
GWR = OT/SO wins ÷ (OT/SO wins + OT/SO losses) × 100
Gimmick Win Rate (GWR) allows us to drill into whether teams consistently win their extra point opportunities, while Gimmick Win Dependency asks how much of their win total relied on a proverbial skills competition.
San Jose being top 10 in GWD in all five seasons means that extra-time victories repeatedly made up a large share of its relatively modest win totals.
But their extra-time win rate ranked 21st, 32nd, 29th, 30th, then eighth. Until last season, the Sharks were not consistently good at winning those games.
Los Angeles - because of course - had 13 extra-time wins last season yet lost 20 games after regulation. Its 13–20 extra-time record gave it a 39.4% GWR, 24th in the league.
So viewing the grass from one side turns LA into total “loser point merchants”, but from the other - even a higher share of GWD did not make the Kings extra-time specialists. They played an insane number of games that went beyond regulation, but they lost the majority of them.
A Beautiful Mess of Made Up Metrics
So in effect, Gimmick Win Rate becomes a sort of central metric connecting both sides of our extra point coin.

Every game tied after 60 minutes puts two teams at a fork in the road. Win in overtime or a shootout, and that result becomes part of a team’s gimmick-win story. Lose, and it becomes part of their loser-point story.
Gimmick Win Rate tells us which direction a team tends to go once it reaches that fork. “Gimmick Win Dependency” tells us how much its win total depends on taking the winning path, while “Loser Point Efficiency” tells us how often its losses took the other one.
That makes the two supposedly competing complaints about NHL points harder to separate in my eyes, and certainly makes yelling at me on Reddit seem like a waste of time.
The same team can be a “loser-point merchant” and a “gimmick-win addict” simply by playing a lot of games that wind up tied after regulation. Last year’s Kings are the peak example: 13 wins and 20 losses after 60 minutes. Whether you admire their knack for hanging around or recoil at their lack of win-tegrity, it’s just a silly way to look at the data.
If there’s a lesson from five seasons of this nonsense, it’s that we should watch how often teams reach extra time, then what they do when they get there, before declaring them “elite” at earning either outcome. And that I shouldn't share my blog posts on Reddit anymore. Alas!
This concludes our pre-season trilogy of articles. Read the “About This Site” post if you haven’t already, and check out the deep dive into “loser point” stats that Reddit took such offense to. Feel free to follow me on Twitter as well, where I’ve decided against my better judgement to activate an account and occasionally tweet things about losing well (or winning cheaply) in the NHL.
See you all at the rink!